
Recently, Dr. Chen Yue, Researcher Hu Qingmiao and Researcher Yang Rui of Engineering Alloy Research Department of Shenyang Materials Science National (Joint) Laboratory used first-principles methods combined with evolutionary algorithms to predict the crystal structure of yttrium at pressures above 100 GPa Under the conditions, the superconducting transition temperature Tc decreases as the pressure P increases, which is opposite to the Tc-P relationship below 100 GPa.
The rare earth metal element yttrium undergoes a superconducting transition under high pressure and is one of the elements with the highest superconducting transition temperature. Experimental research shows that when the pressure is lower than about 100 GPa, the superconducting transition temperature of yttrium monotonously increases with increasing pressure. On the other hand, as the pressure increases, a rich structural phase transition occurs in yttrium. When the pressure increases from 0 to about 100 GPa, the structural phase transformation sequence of yttrium is hcp → Sm-type → dhcp → dfcc. Therefore, it is of great theoretical significance and practical value to study the coupling of yttrium's high-pressure structural transition and superconducting transition temperature. At present, the highest pressure reported in the literature is about 100 GPa. The crystal structure of yttrium at higher pressures and whether higher superconducting transition temperatures can be obtained by increasing the pressure are a frontier issue in the field of superconductivity and high-pressure research.
Researchers of the Engineering Alloy Research Department used first principles combined with evolutionary algorithms to predict that at around 97 GPa, yttrium undergoes a structural phase change from dfcc to oF16-Fddd or hP3-P3121. Two new high-voltage crystal structures oF16-Fddd and hP3-P3121 have lower energy than other crystal structures (Figure 1). The calculation results of phonon scattering spectrum show that there is no vibration imaginary frequency in either structure. The above results indicate that the oF16-Fddd and hP3-P3121 structures can stably exist above 97GPa from the perspective of energy and dynamics. By analyzing the electron partial wave state density, energy band and charge density, the study found that s → d electron transfer under high pressure and electron segregation at the lattice gap have important contributions to the stability of oF16-Fddd and hP3-P3121 phases.
On the basis of determining the stable phase structure of yttrium under different pressures, the researchers used the first principle linear response theory to predict the superconducting transition temperature Tc corresponding to the stable crystal structure of yttrium under different pressures. Below 100 GPa, Tc increases monotonically with increasing pressure, which is in good agreement with the experimental value (Figure 2). But when the pressure is greater than 100 GPa, the theoretical calculation predicts that Tc will decrease as the pressure increases. This means that the method of increasing pressure cannot be used to obtain a higher yttrium superconducting transition temperature.
This research work is of great significance for understanding the high-pressure phase transition and superconducting transition of yttrium, and has guided the direction of experimental research in related fields. The research results were published in Physical Review Letters 109, 159004 (2012). Related work was also published in Physical Review B, 84, 132101 (2011).
These studies were supported by the Ge Tingsui Award Fellowship of the Institute of Metal Research of the Chinese Academy of Sciences, the Wang Kuancheng Postdoctoral Work Award Fund of the Chinese Academy of Sciences, and the National Key Basic Research Program (973 Program).
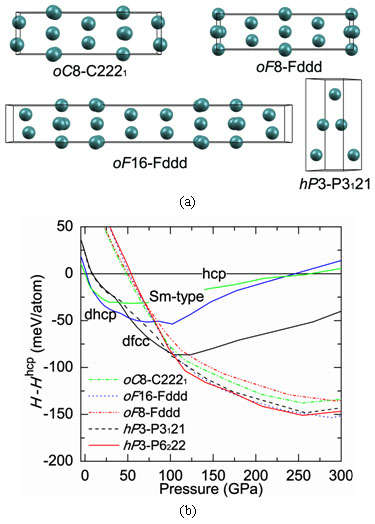
Figure 1 Schematic diagram of a new type of high-pressure crystal structure that yttrium may exist (a); the enthalpy of different crystal structures changes with pressure (b)
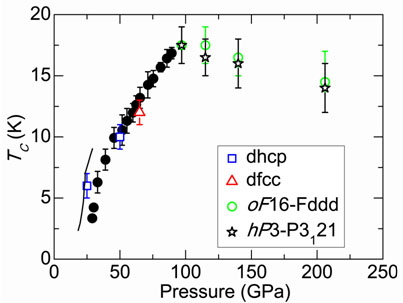
Figure 2 Comparison of calculated and experimental values ​​of yttrium superconducting transition temperature at different pressures (black dots and solid lines indicate experimental values).
NINGBO HOZ TRADING CO.,LTD , https://www.hoz-kitchenware.com